Weekly Reports (Archive)
Monthly Reports (Archive)

What Is The Gold Market Telling US? September 2, 2013
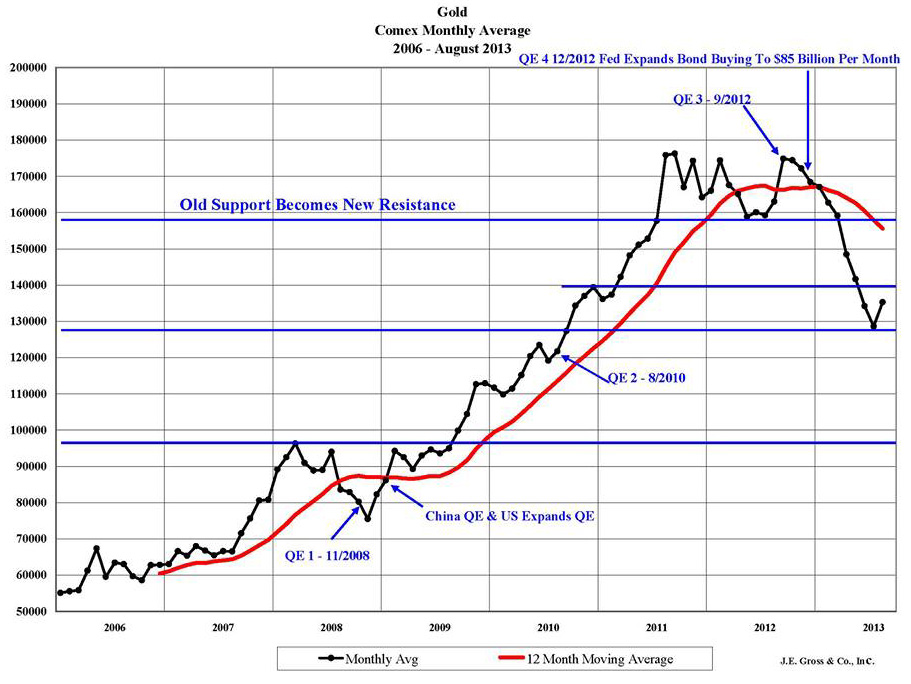
The price of gold peaked at $1,762 on a monthly average basis in September 2011. Since then, the market has tried and failed three times to move beyond that high watermark, prompting many to throw in the... towel, and proclaim the end of the 12 year old bull market.
The last push to the upside coincided with the third round of quantitative easing in September 2012. But instead of rising to the occasion as we saw consistently with each QE handout, the gold market seemed to signal that enough was enough, as it ignored the charitable gift and abruptly headed south. Even the 4th round of QE failed to resuscitate the recalcitrant bulls, as gold fell for ten consecutive months through July 2013.
By our reckoning, this was the longest losing streak since 1981 when the market fell 40% over a similar 10 month period, to include a record 37% year over year loss in July 1981. Further, with the monthly average price falling to $1,286 this past July, we are looking at a record $307 year over year loss, and representing a near 20% drop since last July.
Coincident with, or contributing to the overall decline in gold, the US dollar has strengthened considerably, with double digit percentage gains posted against most other major currencies, with the exception of the Euro.
So the question is, are we 1) Seeing the gold market moving higher during August in response to Middle East tensions, or 2) Is it simply a long overdue technical correction that accompanies a market that has moved too far, too fast ?
Long-term historical patterns suggest that the overall downtrend will persist, with still lower prices on the horizon. Conversely, if the monthly average price can manage to get back over resistance at the $1,600 level, it will then pose a challenge to the previous highs and reflect a heightened level of uncertainty for the global economy overall.