Weekly Reports (Archive)
Monthly Reports (Archive)

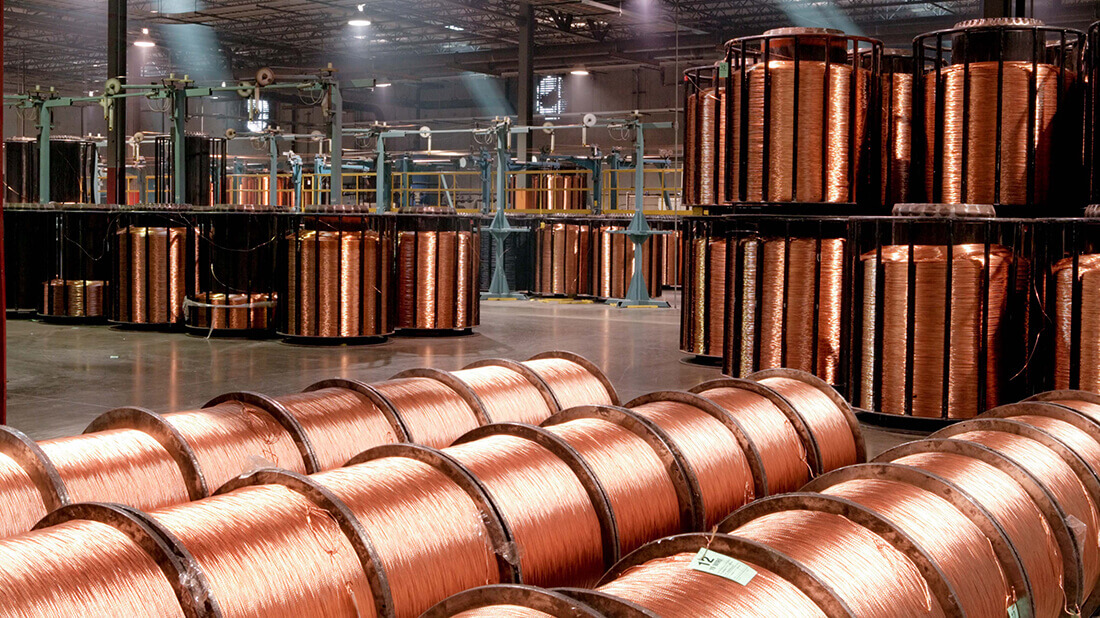
Where's The Metal? March 1st, 2019 by John Gross
A few weeks ago, we looked at total inventories of all metals held in exchange warehouses, and it is timely to revisit the analysis again.
So take a look at the first chart in this week’s report, because it is an eye opener.
In 2013, inventories of copper, aluminum, lead, tin, nickel, and zinc were just a tad shy of 8 million metric tonnes.
As you can see, today, these stocks stand at just 2 million mt, with aluminum representing the vast majority of metal held.
Note also, that we have to go back to 2008 when total metal inventories last stood at this level.
From an entirely different point of view, notice that in 2009, 2010, and 2011, as inventories rose, so too did metal prices, as represented by the Base Metals Barometer, when the ‘Quantitative Easing’ program distorted normal market relationships.
Conversely, although inventories peaked in 2013 and began falling, prices also fell through 2015.
Since then, more metal has moved out of warehouses, with prices trending higher until June of 2018, when all the trade and tariff issues threw a wrench into the gears.
Next take a look at the individual industrial metal charts, and you see pretty much the same story unfolding for each one.
That is to say, there isn’t much metal left in storage, and with prices off their recent lows and beginning to advance, we could be looking at what appears to be the next leg up.
Interestingly, over the weekend, President Trump expressed his view that the U.S. dollar is too strong.
Now, take low inventories, add rising prices, throw in a weaker dollar, and we have the ingredients for a serious move higher.
But we shouldn’t get too far ahead of ourselves, instead, ‘let the market tell you what it wants to do’.
Regards,
John
View Charts (PDF)